Community Results: Bus Stop Analysis
This section presents the results of the visual bus stop analysis and is organized into two parts. The first provides a concise summary of the key findings, while the second features an interactive map that allows users to view the on-site conditions of selected bus stops.
Data Collection, Ridership, and Popular Times
The visual bus stop survey was conducted by graduate student volunteers from the University of San Francisco, who were stationed at select bus stops in Chinatown over a one-month period. Volunteers recorded the number of passengers boarding (“Ons”) and alighting (“Offs”) at the following locations:
1 California: Stockton & Clay
1 California: Stockton & Sacramento
T Subway: Rose Pak Station
8/30/45 Stockton & Washington (across from each other)
12 Broadway & Stockton
12 Pacific & Stockton
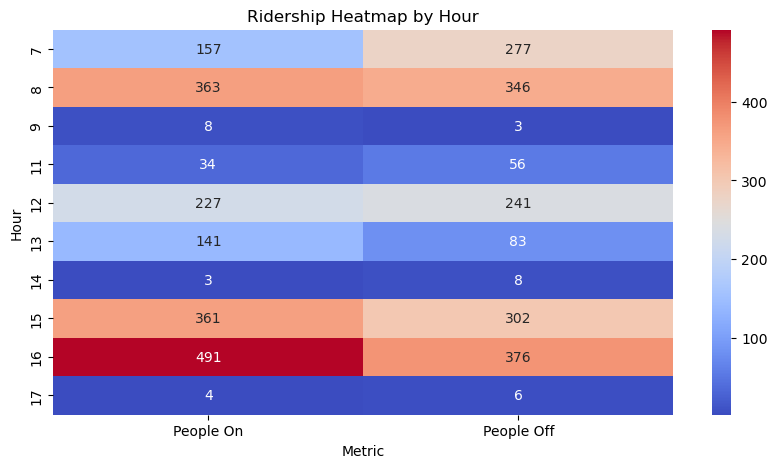
The data provide valuable insights into how transit is utilized at these stops. Figure 1 shows peak ridership at 7 AM, 8 AM, 12 PM, 3 PM, and 4 PM, with the highest number of passengers getting off in Chinatown at 7 AM. This pattern is confirmed in Figure 3, where the average number of alightings is higher than boardings across most stops.
Overall, the data reveal more Offs than Ons, suggesting that Chinatown is a major destination for riders. Figure 2 highlights ridership by stop, showing that the T Subway line carried the largest number of riders (over 1,000 during the study period). The 1 California – Stockton & Clay stop had the highest number of people arriving in Chinatown but the fewest boarding, indicating it functions primarily as a destination stop.
Volunteers also observed notable travel patterns: children and parents were frequent riders in the mornings and evenings, most likely traveling to and from school.

Interactive Map
The interactive map below provides basic information about each bus stop, along with photographs illustrating current on-site conditions.