Survey Results: Transit Dependency
In this analysis, we examine the transit dependency of respondents from both the community and intercept surveys. The first section covers the questions common to both surveys, the second focuses on the community survey results, and the third presents findings from the intercept survey.
Understanding the Surveys
Understanding the demographics of survey respondents and their needs is an important context for understanding their reliance on public transportation.
From the Community Tenant Association (CTA) and Ping Yuen Resident Improvement Association (PYRIA)surveys, we found that most respondents were 65 years or older, indicating that a significant share of local Chinatown community members represented in the surveys are seniors.
In contrast, the intercept survey captured a broader demographic spread: 40% seniors, 52.6% adults aged 19–64, and the remainder were youth.
These demographics underscore the importance of maintaining reliable transit options that support both seniors—who may have limited mobility alternatives—and working-age adults who rely on public transit for commuting, school, and daily needs.
Both the community and intercept surveys confirm the extent of transit dependency among people traveling to Chinatown.
Community surveys (Figure 3): Of 226 respondents, 221 reported that public transit or walking is their only option for reaching Chinatown.
Intercept surveys (Figure 6): Of 2,006 respondents, 1,831 said the same: that they rely solely on public transit or walking to travel to Chinatown.
These findings underscore that public transit is not just one option, but an essential lifeline. Without reliable transit service, many community members and visitors would be forced to walk long distances—or would lose access to Chinatown altogether.
Maintaining strong public transit is therefore critical, not only for Chinatown residents but also for San Franciscans citywide who depend on transit to connect with the neighborhood.
Community Surveys (CTA & PYRIA)
The community surveys show a strong presence of older adults among respondents. As seen in Figure 1, 236 out of 263 respondents (89.7%) are age 65 or older. Given this demographic profile, it is essential to understand how older adults in Chinatown travel in order to ensure their mobility needs are met.
Figure 2: Mode of Travel to Chinatown illustrates that the vast majority of respondents either walk or take public transit, with only a small minority relying on cars or alternative transportation services. This indicates that most respondents aged 65 and older depend on walking or transit to reach Chinatown.
For many in the local community, public transportation is not simply a convenience but an essential service. Without it, residents—particularly older adults—would be left with walking as their only option, which is far from ideal for those with limited mobility.
This dependency is reinforced in Figure 3: Public Transit or Walking Is My Only Option Traveling to Chinatown, where 221 out of 226 respondents agreed that they have no other means of getting to Chinatown.

Figure 1

Figure 2
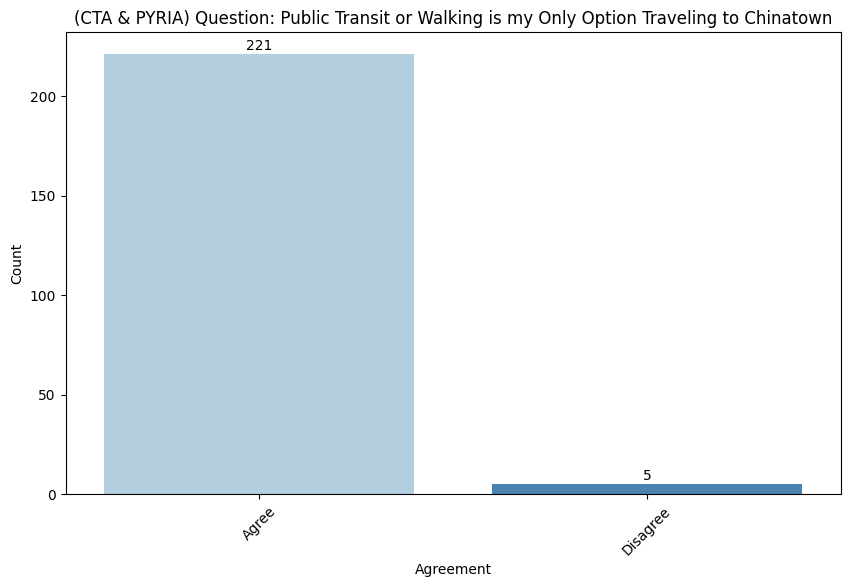
Figure 3
Intercept Survey
The intercept survey captured a more diverse demographic profile compared to the community survey. Figure 4 shows a sample of 145 youth, 1,046 adults, and 795 older adults. While adults and older adults make up the majority, youth are also represented. This distribution reflects the broader commuter population traveling to Chinatown, including both San Francisco residents and visitors.
As shown in Figure 5, 1,831 out of 2,006 respondents reported that they rely on public transit or walking to reach Chinatown. This demonstrates a high level of transit dependency not only within the local community but also across a more general, citywide population.
Figure 6 shows that most people coming to Chinatown rely on public transit: 69% of youth, 90% of adults, and 97% of older adults. Adults use transit heavily for work and shopping, while older adults depend on it almost entirely. These findings highlight that public transit is essential for keeping Chinatown accessible to residents, workers, and visitors alike.
Figure 7 compares transit dependency between San Francisco residents and non-residents. As expected, San Francisco residents are more transit-dependent (92.1%) than non-residents (73.8%).
Non-residents who do rely on transit often use regional systems such as Bay Area Rapid Transit (BART) or Caltrain, transferring to local Muni service to reach Chinatown.

Figure 4

Figure 5

Figure 6

Figure 7
In summary, this analysis highlights the high level of transit dependency among both Chinatown residents and visitors. Youth, adults, and older adults alike rely on public transportation not as one option among many, but as the primary—and often only—means of accessing the neighborhood.
For many, public transit is an essential service that sustains access to Chinatown’s jobs, services, businesses, and cultural resources. Without it, the community’s mobility and connection to the neighborhood would be severely compromised.